


| Index | 15 Mar 2024 | Week | 08 Mar 2024 | Month | 29 Feb 2024 | Since→ | 31 Dec 2021 |
|---|---|---|---|---|---|---|---|
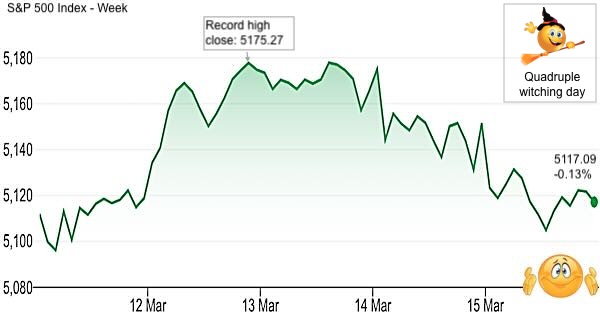
| S&P500 | 5,117.09 | -0.13% | 5,123.69 | 0.42% | 5,095.63 | 7.28% | 4,769.83 |
| Dow Jones | 38,714.77 | -0.02% | 38,722.00 | -0.72% | 38,996.39 | 2.72% | 37,689.54 |
| NASDAQ | 15,973.17 | -0.7% | 16,085.11 | -0.74% | 16,091.92 | 6.41% | 15,011.35 |
| Denomination | 15 Mar 2024 | Week | 08 Mar 2024 | Month | 29 Feb 2024 | Since→ | 31 Dec 2021 |
|---|---|---|---|---|---|---|---|
| USD | 10.920 | 0.9% | 10.822 | -3.43% | 11.308 | -6.95% | 11.736 |
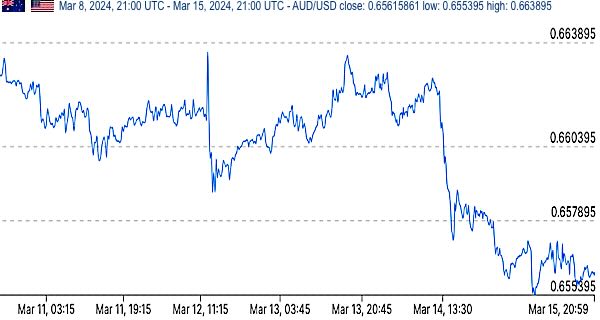
| AUD | 16.643 | 1.82% | 16.346 | -4.33% | 17.396 | -3.35% | 17.220 |
| AAPL: Apple Inc |
15 Mar 2024 | Change | 08 Mar 2024 | |
|---|---|---|---|---|
| Friday close | $172.62 | 1.11% | $170.73 | |
| P/E (historical) | 26.89 | | 26.59 | |
| P/E (1 year fwd) | 26.41 | |
25.80 | |
| Market Cap | $2,665.577 bn | $29.185 bn | $2,636.392 bn | |
| Forecast growth: Target/Price | 18.68% | |||
| Last earnings report | 2024-02-01 Q1/2024 | |||
| Earnings | NASDAQ | |||
| Financials | NASDAQ | |||
| SEC filings | Edgar Search CIK 320183 | |||
| Press releases | Press | |||
| News headlines | News | |||
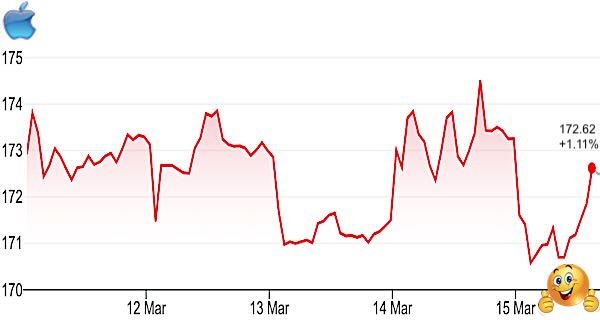
^ Price movements this week (mouseover for 1-year view) Chart: Google Finance | ||||
| AMZN: Amazon Com Inc |
15 Mar 2024 | Change | 08 Mar 2024 | |
|---|---|---|---|---|
| Friday close | $174.42 | -0.53% | $175.35 | |
| P/E (historical) | 60.14 | | 60.47 | |
| P/E (1 year fwd) | 43.61 | |
43.55 | |
| Market Cap | $1,811.767 bn | $-9.660 bn | $1,821.427 bn | |
| Forecast growth: Target/Price | 19.53% | |||
| Last earnings report | 2024-02-01 Q4/2023 | |||
| Earnings | NASDAQ | |||
| Financials | NASDAQ | |||
| SEC filings | Edgar Search CIK 1018724 | |||
| Press releases | Press | |||
| News headlines | News | |||
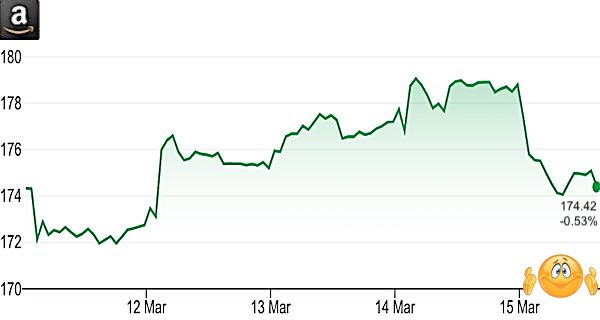
^ Price movements this week (mouseover for 1-year view) Chart: Google Finance | ||||
| TEAM: Atlassian Corp Plc |
15 Mar 2024 | Change | 08 Mar 2024 | |
|---|---|---|---|---|
| Friday close | $194.43 | -6.88% | $208.80 | |
| P/E (historical) | 0.00 | unch | 0.00 | |
| P/E (1 year fwd) | -494.39 | |
-495.02 | |
| Market Cap | $50.436 bn | $-3.728 bn | $54.164 bn | |
| Forecast growth: Target/Price | 31.18% | |||
| Last earnings report | 2024-02-01 Q2/2024 | |||
| Earnings | NASDAQ | |||
| Financials | NASDAQ | |||
| SEC filings | Edgar Search CIK 1650372 | |||
| Press releases | Press | |||
| News headlines | News | |||
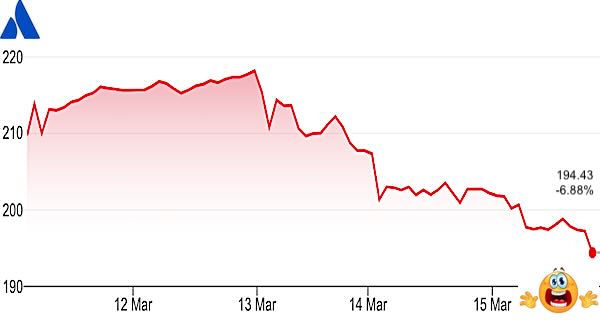
^ Price movements this week (mouseover for 1-year view) Chart: Google Finance | ||||
| EBAY: Ebay Inc |
15 Mar 2024 | Change | 08 Mar 2024 | |
|---|---|---|---|---|
| Friday close | $52.20 | 3.63% | $50.37 | |
| P/E (historical) | 10.00 | | 9.65 | |
| P/E (1 year fwd) | 14.35 | |
13.95 | |
| Market Cap | $27.040 bn | $0.948 bn | $26.092 bn | |
| Forecast growth: Target/Price | -4.50% | |||
| Last earnings report | 2023-11-07 | |||
| Earnings | NASDAQ | |||
| Financials | NASDAQ | |||
| SEC filings | Edgar Search CIK 1065088 | |||
| Press releases | Press | |||
| News headlines | News | |||
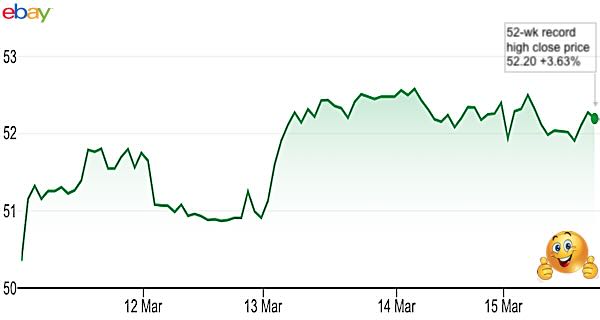
^ Price movements this week (mouseover for 1-year view) Chart: Google Finance | ||||
 FB: Meta Platforms Inc FB: Meta Platforms Inc |
15 Mar 2024 | Change | 08 Mar 2024 | |
|---|---|---|---|---|
| Friday close | $484.10 | -4.32% | $505.95 | |
| P/E (historical) | 32.49 | | 33.96 | |
| P/E (1 year fwd) | 24.67 | |
25.69 | |
| Market Cap | $1,234.167 bn | $-55.705 bn | $1,289.872 bn | |
| Forecast growth: Target/Price | 9.23% | |||
| Last earnings report | 2024-02-02 Q2/2023 | |||
| Earnings | NASDAQ | |||
| Financials | NASDAQ | |||
| SEC filings | Edgar Search CIK 1326801 | |||
| Press releases | Press | |||
| News headlines | News | |||
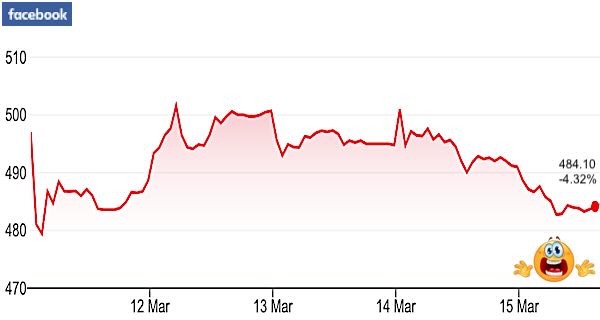
^ Price movements this week (mouseover for 1-year view) Chart: Google Finance | ||||
| GOOGL: Alphabet Inc. |
15 Mar 2024 | Change | 08 Mar 2024 | |
|---|---|---|---|---|
| Friday close | $141.18 | 4.26% | $135.41 | |
| P/E (historical) | 24.34 | | 23.35 | |
| P/E (1 year fwd) | 21.14 | |
19.85 | |
| Market Cap | $1,755.291 bn | $71.738 bn | $1,683.553 bn | |
| Forecast growth: Target/Price | 16.58% | |||
| Last earnings report | 2024-01-30 Q4/2023 | |||
| Earnings | NASDAQ | |||
| Financials | NASDAQ | |||
| SEC filings | Edgar Search CIK 1652044 | |||
| Press releases | Press | |||
| News headlines | News | |||
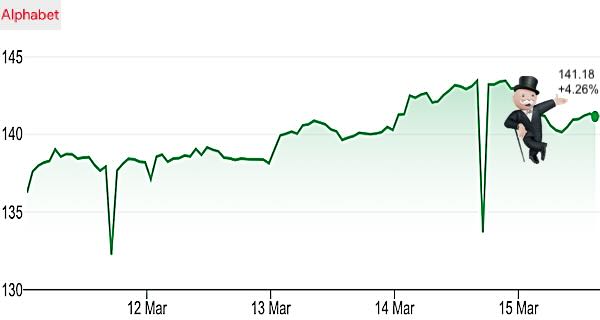
^ Price movements this week (mouseover for 1-year view) Chart: Google Finance | ||||
| PYPL: PayPal Holdings, Inc. |
15 Mar 2024 | Change | 08 Mar 2024 | |
|---|---|---|---|---|
| Friday close | $62.85 | 6.51% | $59.01 | |
| P/E (historical) | 16.37 | | 15.37 | |
| P/E (1 year fwd) | 16.11 | |
14.96 | |
| Market Cap | $67.359 bn | $4.115 bn | $63.243 bn | |
| Forecast growth: Target/Price | 7.48% | |||
| Last earnings report | 2024-02-07 Q3/2023 | |||
| Earnings | NASDAQ | |||
| Financials | NASDAQ | |||
| SEC filings | Edgar Search CIK 1633917 | |||
| Press releases | Press | |||
| News headlines | News | |||
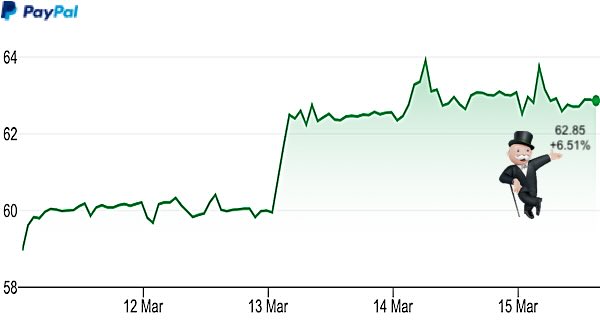
^ Price movements this week (mouseover for 1-year view) Chart: Google Finance | ||||
| V: Visa Inc. |
15 Mar 2024 | Change | 08 Mar 2024 | |
|---|---|---|---|---|
| Friday close | $283.02 | 1.06% | $280.05 | |
| P/E (historical) | 32.57 | | 32.23 | |
| P/E (1 year fwd) | 28.93 | |
28.11 | |
| Market Cap | $519.769 bn | $5.454 bn | $514.315 bn | |
| Forecast growth: Target/Price | 8.59% | |||
| Last earnings report | 2024-01-25 Q1/2024 | |||
| Earnings | NASDAQ | |||
| Financials | NASDAQ | |||
| SEC filings | Edgar Search CIK 1403161 | |||
| Press releases | Press | |||
| News headlines | News | |||
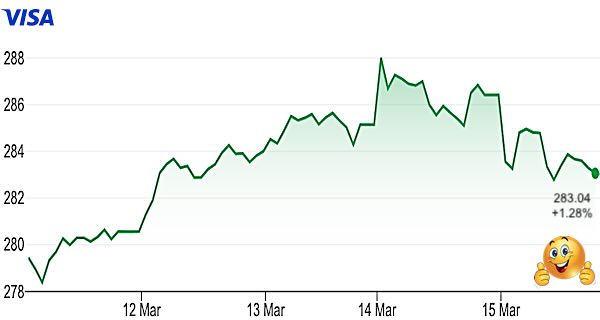
^ Price movements this week (mouseover for 1-year view) Chart: Google Finance | ||||
 IONQ: IonQ, Inc IONQ: IonQ, Inc |
15 Mar 2024 | Change | 08 Mar 2024 | |
|---|---|---|---|---|
| Friday close | $9.32 | -13.83% | $10.81 | |
| P/E (historical) | 0.00 | unch | 0.00 | |
| P/E (1 year fwd) | -7.42 | |
-8.79 | |
| Market Cap | $1.940 bn | $-0.311 bn | $2.251 bn | |
| Forecast growth: Target/Price | 78.53% | |||
| Last earnings report | 2024-02-28 2023/Q4 | |||
| Earnings | NASDAQ | |||
| Financials | NASDAQ | |||
| SEC filings | Edgar Search CIK 0 | |||
| Press releases | Press | |||
| News headlines | News | |||
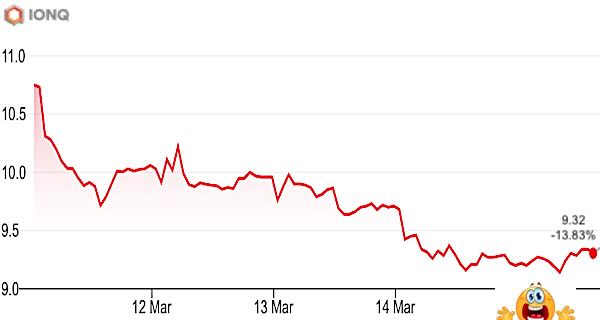
^ Price movements this week (mouseover for 1-year view) Chart: Google Finance | ||||