


| Index | 12 Apr 2024 | Week | 05 Apr 2024 | Month | 31 Mar 2024 | Since→ | 31 Dec 2021 |
|---|---|---|---|---|---|---|---|
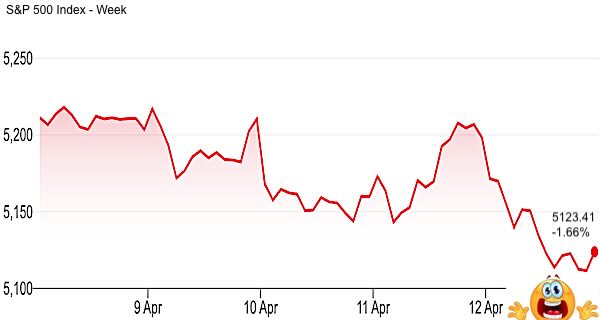
| S&P500 | 5,123.41 | -1.66% | 5,209.91 | -2.49% | 5,254.35 | 7.41% | 4,769.83 |
| Dow Jones | 37,983.24 | -2.32% | 38,883.67 | -4.58% | 39,807.37 | 0.78% | 37,689.54 |
| NASDAQ | 16,175.09 | -0.81% | 16,306.64 | -1.25% | 16,379.46 | 7.75% | 15,011.35 |
| Denomination | 12 Apr 2024 | Week | 05 Apr 2024 | Month | 31 Mar 2024 | Since→ | 31 Dec 2021 |
|---|---|---|---|---|---|---|---|
| USD | 11.312 | 2.97% | 10.985 | 3.09% | 10.972 | -3.62% | 11.736 |
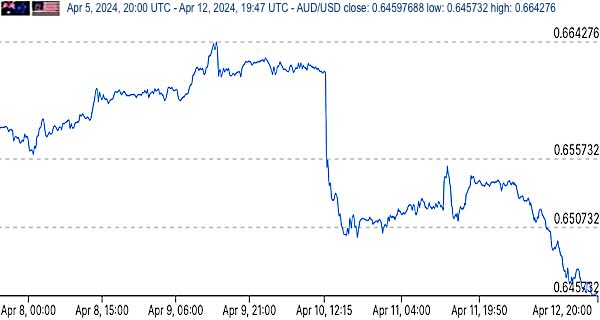
| AUD | 17.510 | -0.14% | 17.535 | 3.99% | 16.839 | 1.69% | 17.220 |
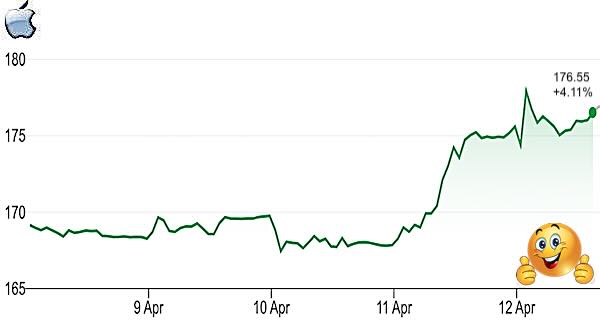
| AAPL: Apple Inc |
12 Apr 2024 | Change | 05 Apr 2024 | |
|---|---|---|---|---|
| Friday close | $176.55 | 4.11% | $169.58 | |
| P/E (historical) | 27.50 | | 26.41 | |
| P/E (1 year fwd) | 26.72 | |
25.77 | |
| Market Cap | $2,726.264 bn | $107.630 bn | $2,618.634 bn | |
| Forecast growth: Target/Price | 14.85% | |||
| Last earnings report | 2024-02-01 Q1/2024 | |||
| Earnings | NASDAQ | |||
| Financials | NASDAQ | |||
| SEC filings | Edgar Search CIK 320183 | |||
| Press releases | Press | |||
| News headlines | News | |||
^ Price movements this week (mouseover for 1-year view) Chart: Google Finance | ||||
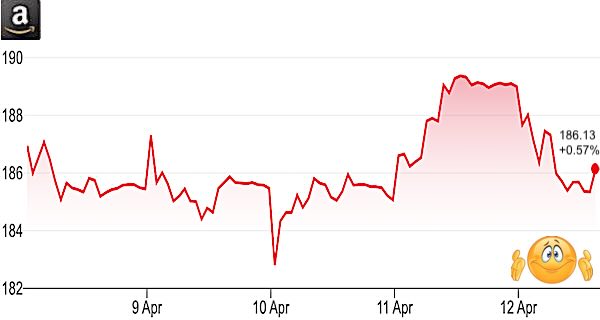
| AMZN: Amazon Com Inc |
12 Apr 2024 | Change | 05 Apr 2024 | |
|---|---|---|---|---|
| Friday close | $186.13 | 0.57% | $185.07 | |
| P/E (historical) | 64.18 | | 63.82 | |
| P/E (1 year fwd) | 46.34 | |
44.12 | |
| Market Cap | $1,933.403 bn | $11.011 bn | $1,922.393 bn | |
| Forecast growth: Target/Price | 13.32% | |||
| Last earnings report | 2024-02-01 Q4/2023 | |||
| Earnings | NASDAQ | |||
| Financials | NASDAQ | |||
| SEC filings | Edgar Search CIK 1018724 | |||
| Press releases | Press | |||
| News headlines | News | |||
^ Price movements this week (mouseover for 1-year view) Chart: Google Finance | ||||
| TEAM: Atlassian Corp Plc |
12 Apr 2024 | Change | 05 Apr 2024 | |
|---|---|---|---|---|
| Friday close | $206.53 | 5.04% | $196.62 | |
| P/E (historical) | 0.00 | unch | 0.00 | |
| P/E (1 year fwd) | -536.63 | |
-480.80 | |
| Market Cap | $53.575 bn | $2.571 bn | $51.005 bn | |
| Forecast growth: Target/Price | 24.10% | |||
| Last earnings report | 2024-02-01 Q2/2024 | |||
| Earnings | NASDAQ | |||
| Financials | NASDAQ | |||
| SEC filings | Edgar Search CIK 1650372 | |||
| Press releases | Press | |||
| News headlines | News | |||
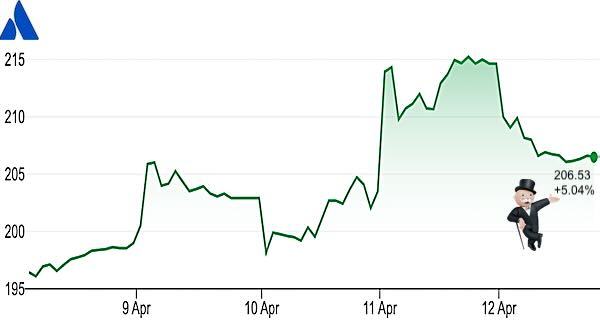
^ Price movements this week (mouseover for 1-year view) Chart: Google Finance | ||||
| EBAY: Ebay Inc |
12 Apr 2024 | Change | 05 Apr 2024 | |
|---|---|---|---|---|
| Friday close | $51.31 | -1.44% | $52.06 | |
| P/E (historical) | 9.83 | | 9.97 | |
| P/E (1 year fwd) | 14.05 | |
13.93 | |
| Market Cap | $26.579 bn | $-0.389 bn | $26.967 bn | |
| Forecast growth: Target/Price | -2.46% | |||
| Last earnings report | 2023-11-07 | |||
| Earnings | NASDAQ | |||
| Financials | NASDAQ | |||
| SEC filings | Edgar Search CIK 1065088 | |||
| Press releases | Press | |||
| News headlines | News | |||
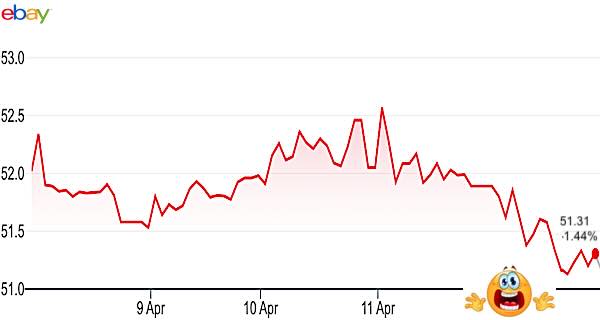
^ Price movements this week (mouseover for 1-year view) Chart: Google Finance | ||||
 FB: Meta Platforms Inc FB: Meta Platforms Inc |
12 Apr 2024 | Change | 05 Apr 2024 | |
|---|---|---|---|---|
| Friday close | $511.90 | -2.93% | $527.34 | |
| P/E (historical) | 34.36 | | 35.39 | |
| P/E (1 year fwd) | 26.12 | |
25.62 | |
| Market Cap | $1,305.040 bn | $-39.363 bn | $1,344.403 bn | |
| Forecast growth: Target/Price | 5.58% | |||
| Last earnings report | 2024-02-02 Q2/2023 | |||
| Earnings | NASDAQ | |||
| Financials | NASDAQ | |||
| SEC filings | Edgar Search CIK 1326801 | |||
| Press releases | Press | |||
| News headlines | News | |||
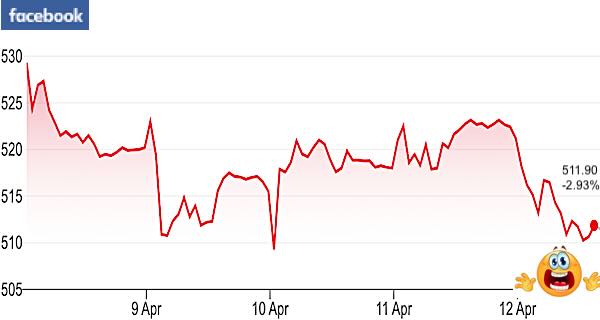
^ Price movements this week (mouseover for 1-year view) Chart: Google Finance | ||||
| GOOGL: Alphabet Inc. |
12 Apr 2024 | Change | 05 Apr 2024 | |
|---|---|---|---|---|
| Friday close | $157.73 | 3.43% | $152.50 | |
| P/E (historical) | 27.19 | | 25.95 | |
| P/E (1 year fwd) | 23.51 | |
22.88 | |
| Market Cap | $1,961.057 bn | $65.025 bn | $1,896.033 bn | |
| Forecast growth: Target/Price | 5.50% | |||
| Last earnings report | 2024-01-30 Q4/2023 | |||
| Earnings | NASDAQ | |||
| Financials | NASDAQ | |||
| SEC filings | Edgar Search CIK 1652044 | |||
| Press releases | Press | |||
| News headlines | News | |||
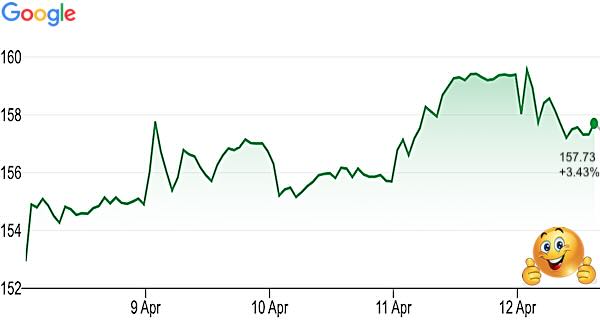
^ Price movements this week (mouseover for 1-year view) Chart: Google Finance | ||||
| PYPL: PayPal Holdings, Inc. |
12 Apr 2024 | Change | 05 Apr 2024 | |
|---|---|---|---|---|
| Friday close | $64.59 | -0.86% | $65.15 | |
| P/E (historical) | 16.82 | | 16.97 | |
| P/E (1 year fwd) | 16.74 | |
16.34 | |
| Market Cap | $69.224 bn | $-0.600 bn | $69.824 bn | |
| Forecast growth: Target/Price | 5.02% | |||
| Last earnings report | 2024-02-07 Q3/2023 | |||
| Earnings | NASDAQ | |||
| Financials | NASDAQ | |||
| SEC filings | Edgar Search CIK 1633917 | |||
| Press releases | Press | |||
| News headlines | News | |||
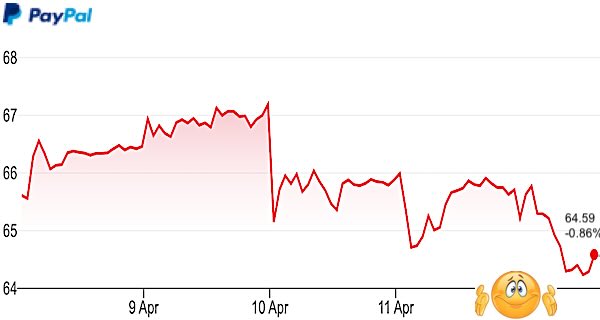
^ Price movements this week (mouseover for 1-year view) Chart: Google Finance | ||||
| V: Visa Inc. |
12 Apr 2024 | Change | 05 Apr 2024 | |
|---|---|---|---|---|
| Friday close | $276.09 | -0.39% | $277.16 | |
| P/E (historical) | 31.76 | | 31.89 | |
| P/E (1 year fwd) | 27.87 | |
27.70 | |
| Market Cap | $507.033 bn | $-1.974 bn | $509.007 bn | |
| Forecast growth: Target/Price | 12.12% | |||
| Last earnings report | 2024-01-25 Q1/2024 | |||
| Earnings | NASDAQ | |||
| Financials | NASDAQ | |||
| SEC filings | Edgar Search CIK 1403161 | |||
| Press releases | Press | |||
| News headlines | News | |||
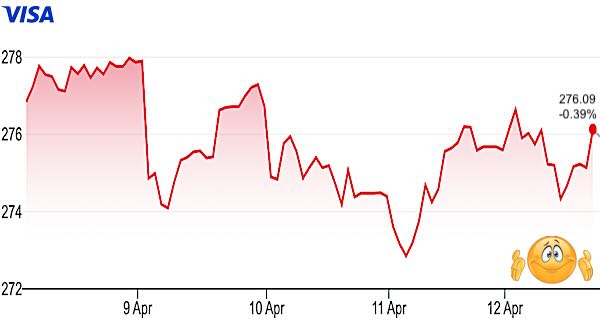
^ Price movements this week (mouseover for 1-year view) Chart: Google Finance | ||||
 IONQ: IonQ, Inc IONQ: IonQ, Inc |
12 Apr 2024 | Change | 05 Apr 2024 | |
|---|---|---|---|---|
| Friday close | $8.04 | -12.7% | $9.21 | |
| P/E (historical) | 0.00 | unch | 0.00 | |
| P/E (1 year fwd) | -6.65 | |
-7.52 | |
| Market Cap | $1.674 bn | $-0.244 bn | $1.918 bn | |
| Forecast growth: Target/Price | 106.84% | |||
| Last earnings report | 2024-02-28 2023/Q4 | |||
| Earnings | NASDAQ | |||
| Financials | NASDAQ | |||
| SEC filings | Edgar Search CIK 0 | |||
| Press releases | Press | |||
| News headlines | News | |||
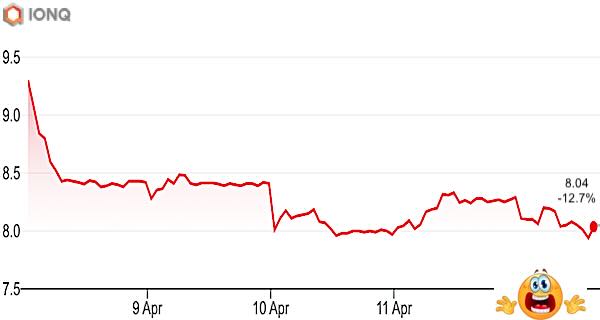
^ Price movements this week (mouseover for 1-year view) Chart: Google Finance | ||||